
Interpreting your BBT Chart -What is it saying?

The BBT chart (basil body temperature chart) can be such a wonderful , interesting and insightful tool when it comes to a woman’s cycle and fertility. The real conundrum is why don’t women and health care providers use it more. One reason my simple be that many women don’t know how to chart their temperatures and then what to do with that information once we have it.
So let’s talk about what the BBT chart is and what it can tell you.
Throughout our menstrual cycle our body temperatures with rise and fall along with our hormones and the different phases of our cycles. When we make a chart or graph of those temperatures ideally these temperatures should result in a predictable picture. Our temperatures should remain with in a certain temperature average for each phase of our cycle. These phases are follicular phase, ovulation, luteal phase and bleeding. Below is an example of of a typical BBT chart (Thank you to White Lotus Naturopathic Clinic for the chart example).
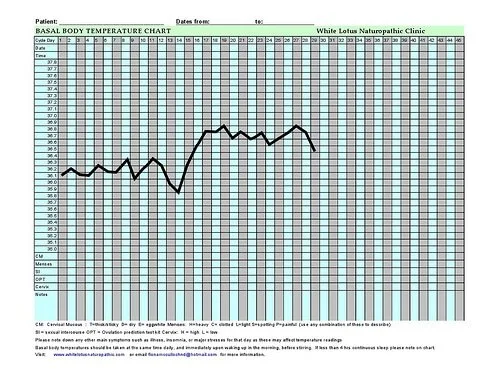
With any chart there should be three distinct areas of note in your chart. A clear follicular phase, a clear dip around ovulation and then a clear luteal phase shown as a sharp increase and leveling of temperatures.
So what does it mean if your chart looks different from the one above? Well it’s showing you that your hormones are out of balance somewhere, and by seeing exactly where your chart looks different we can begin to hone in on which hormones are the possible culprits or if there could possibly be thyroid involvement. From a Traditional Chinese medical point of view it can help us decide if your yin or yang are out of balance and what organ systems we need to treat. Your chart can also help you know if you are ovulating and help to plan for or avoid pregnancy. Another reason I also like to encourage charting is for the purposes of understanding our hormones in relation to PMS symptoms.
So in general what should you be looking for in your chart.
A follicular phase that is at least 10 days long
A luteal phase that is no less then 12 days long.
Temperatures in the follicular phase should be lower than temps in the luteal phase
Average follicular phase temps should be 97.2 degrees or lower
Temperature should rise about 0.4 degrees the day after ovulation.
After ovulation your temperatures remain elevated until your next period.
Average luteal phase temps should be 98.2 or greater
If you notice that your chart and temperatures are not within these ranges and you are also having trouble with fertility , trouble with menstrual regularity, PMS symptoms or even something like hormonal acne, then this is a great time to see your acupuncturist or other healthcare provider. Together you can take a closer look at where your body many be out of balance and what your hormones are doing. If you would just like to learn more about the specifics that your chart is showing, how to start or interpret the data you have come in for an appointment.